CFO Executive Dashboard
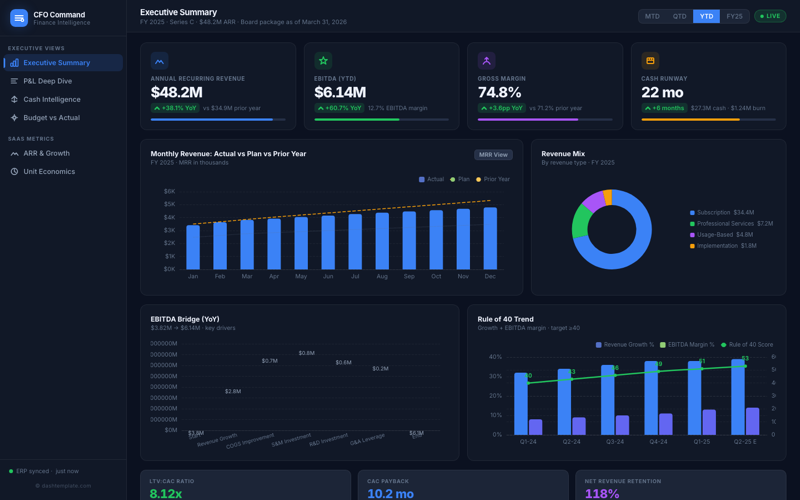
Revenue vs. EBITDA trend, cash conversion cycle, budget variance and burn.
3 production-ready templates — all pro. Real KPIs, real industry logic, realistic mock data.
Revenue vs. EBITDA trend, cash conversion cycle, budget variance and burn.
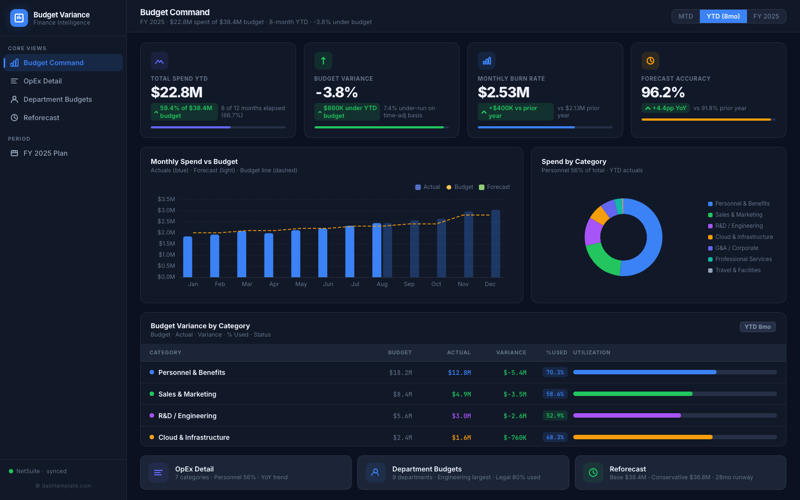
Department-level spend variance, monthly burn vs. plan and forecast accuracy.
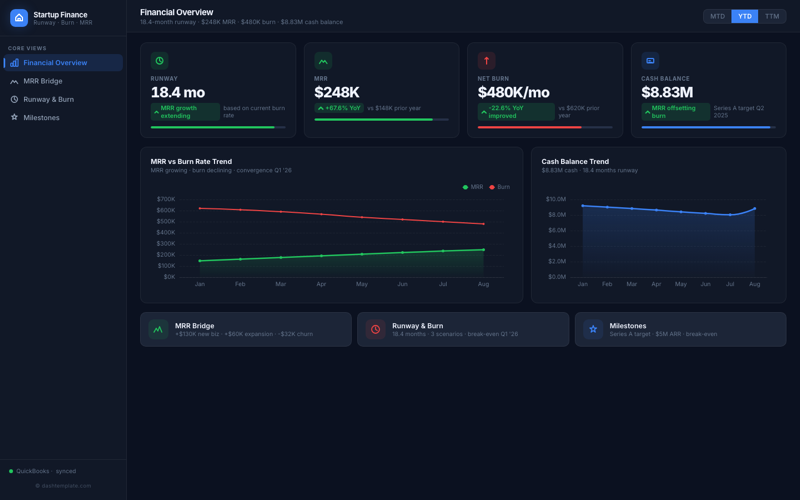
Runway calculator, burn rate, MRR bridge and fundraising milestone tracker.
Building a finance & fp&a dashboard from scratch takes weeks. Our templates ship with realistic mock data, production-ready chart configurations, and the exact KPIs your team needs — so you can focus on connecting your real data instead of reinventing the wheel.
Each template is built with Apache ECharts and TypeScript, giving you full control over every chart, color, and data point. MIT licensed — use freely in client projects, internal tools, and SaaS products.
Pre-configured with the exact metrics that matter for finance & fp&a teams — no generic placeholders.
Every template includes a complete mock data layer — evaluate the dashboard before writing a single API call.
Open the HTML file in your browser and it runs instantly. No build step, no dependencies to install.
Explore other industries
Pick from 3 production-ready templates — $49.99 flat, no subscription.