Sales Pipeline Dashboard
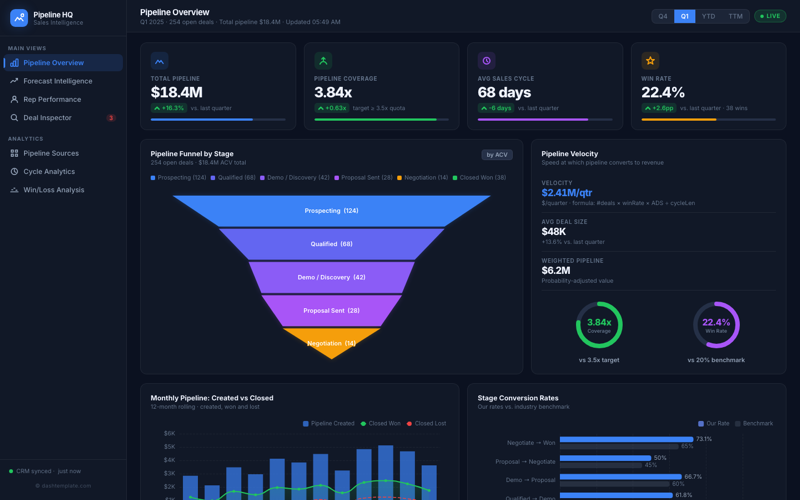
Pipeline coverage ratio, deal velocity, win rate and deals-at-risk table.
4 production-ready templates — all pro. Real KPIs, real industry logic, realistic mock data.
Pipeline coverage ratio, deal velocity, win rate and deals-at-risk table.
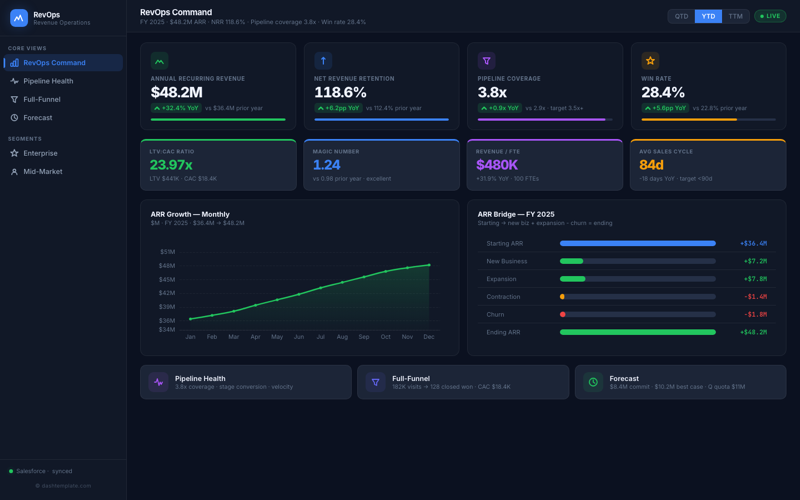
ARR waterfall, Net New ARR, LTV:CAC matrix and three-scenario forecast.
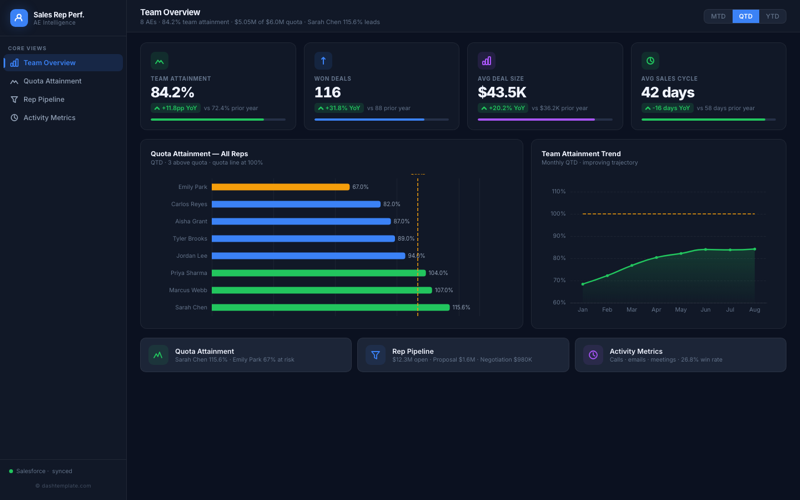
Quota attainment progress, closed revenue waterfall and activity scorecards.
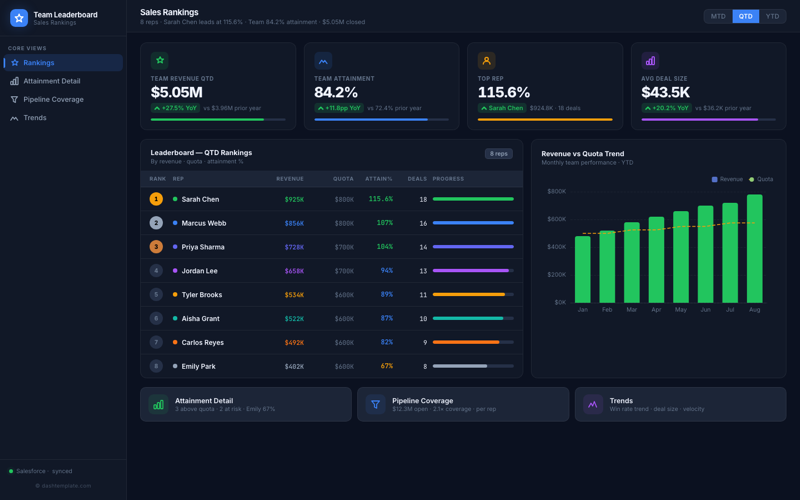
Rep quota ranking, attainment distribution and pipeline coverage per rep.
Building a sales & crm dashboard from scratch takes weeks. Our templates ship with realistic mock data, production-ready chart configurations, and the exact KPIs your team needs — so you can focus on connecting your real data instead of reinventing the wheel.
Each template is built with Apache ECharts and TypeScript, giving you full control over every chart, color, and data point. MIT licensed — use freely in client projects, internal tools, and SaaS products.
Pre-configured with the exact metrics that matter for sales & crm teams — no generic placeholders.
Every template includes a complete mock data layer — evaluate the dashboard before writing a single API call.
Open the HTML file in your browser and it runs instantly. No build step, no dependencies to install.
Explore other industries
Pick from 4 production-ready templates — $49.99 flat, no subscription.