Fleet Operations Dashboard
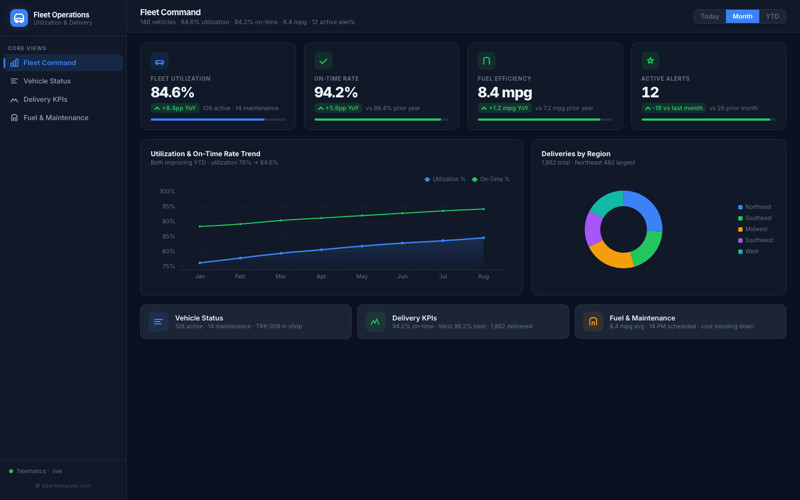
Vehicle utilization, on-time delivery rate, fuel efficiency and maintenance.
3 production-ready templates — all pro. Real KPIs, real industry logic, realistic mock data.
Vehicle utilization, on-time delivery rate, fuel efficiency and maintenance.
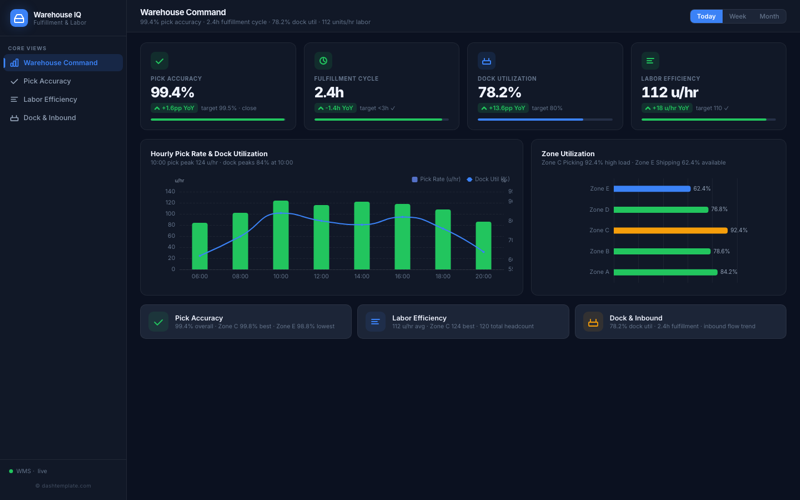
Pick accuracy, order fulfillment cycle, dock utilization and labor efficiency.
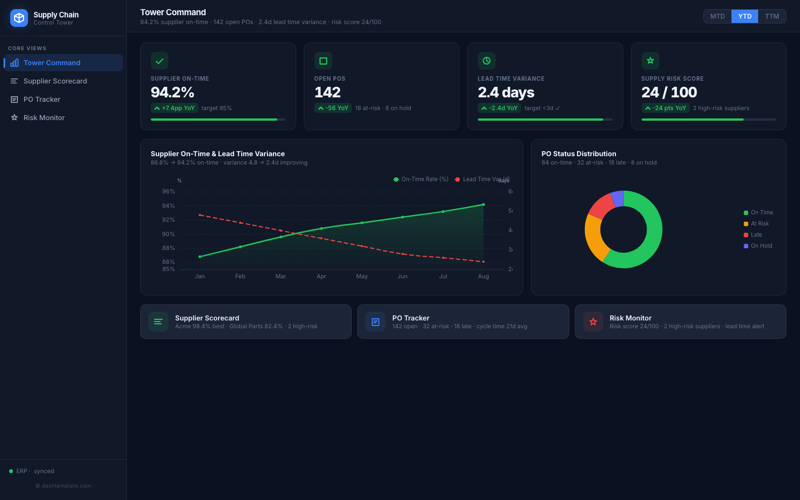
Supplier on-time rate, purchase order status, lead time variance and risk map.
Building a logistics dashboard from scratch takes weeks. Our templates ship with realistic mock data, production-ready chart configurations, and the exact KPIs your team needs — so you can focus on connecting your real data instead of reinventing the wheel.
Each template is built with Apache ECharts and TypeScript, giving you full control over every chart, color, and data point. MIT licensed — use freely in client projects, internal tools, and SaaS products.
Pre-configured with the exact metrics that matter for logistics teams — no generic placeholders.
Every template includes a complete mock data layer — evaluate the dashboard before writing a single API call.
Open the HTML file in your browser and it runs instantly. No build step, no dependencies to install.
Explore other industries
Pick from 3 production-ready templates — $49.99 flat, no subscription.